
Everyone is vibe coding right now. I went a step past the chatbot in a box. I built a team of AI agents to build this website with me, each with its own job, and I worked alongside them. It felt like magic. Here is the question that magic hides: did those agents actually run, or was I paying for a team that only half showed up?
For the last few weeks that is how this site got built. I set the direction, and a team of agents planned, researched, wrote, designed, and reviewed alongside me. One plans and delegates. One researches. One writes. One designs. One reviews before anything ships. I stayed in the loop the whole time, but I was one seat at a table I had staffed with agents, and I could not actually see what the rest of the table was doing. Magic is not measurement.
So I did the boring thing. I built a dashboard that reads the real session logs, the actual transcripts on my machine, and turns them into ground truth. Not what I remembered doing. Not what I wrote in my notes. What actually ran. This post is the whole thing: the gap it closes, what it shows, how the data gets there, and how you can run the same setup on your own agents. Every number and screenshot below is from a sample project, not my live data.
The gap: you are trusting output, not evidence
When you orchestrate agents, you write them once. You give each one a name, a set of tools, and an instruction. Then you hit go and you judge the result. If the blog post reads well, you assume the writer did its job. If the code compiles, you assume the engineer showed up.
But the result is not evidence of the process. You do not actually know which agent ran, how many times, what it cost, which tools it leaned on, or whether one of them has quietly never fired a single time. Your memory is not a log. The session transcripts are. And they are sitting on your disk already, written automatically on every turn, waiting for someone to add them up.
What it is
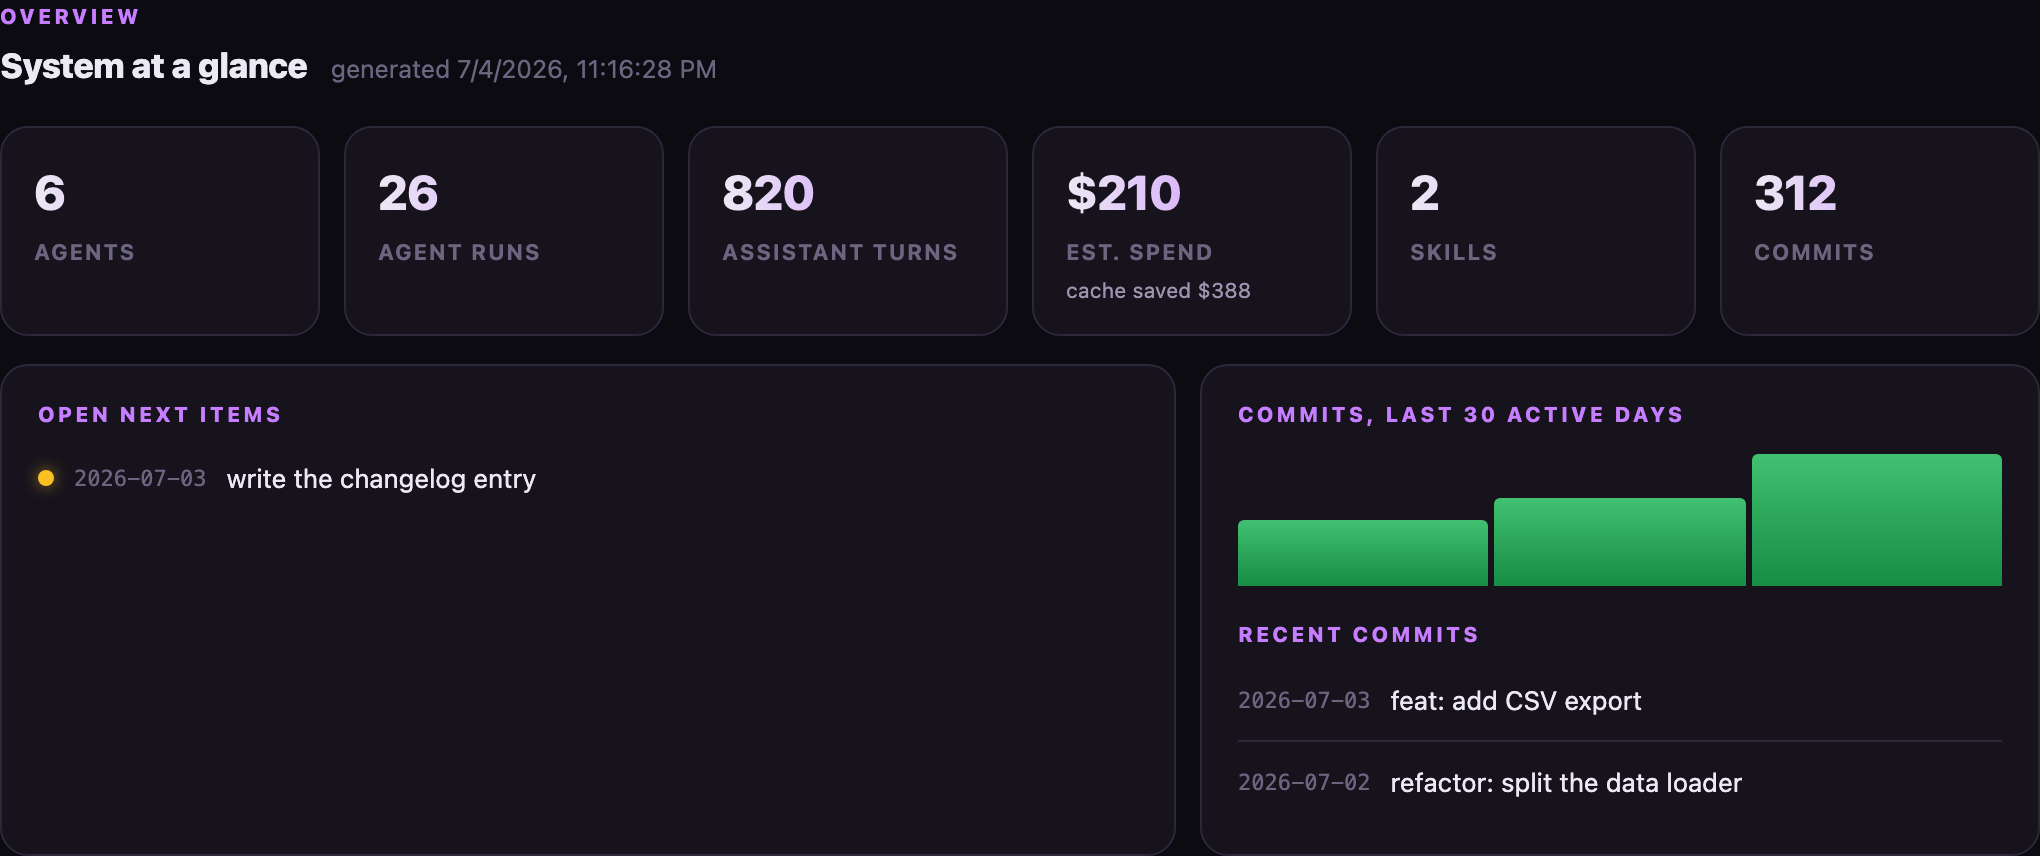
I call it Mission Control. It is a single, self-contained dashboard. Point it at the folder where your agent sessions are recorded, and it parses every turn: who was spawned, what model ran, how many tokens moved, which tools were called, and which of those calls errored. Then it rolls all of that into a view you can read in ten seconds.
It runs locally when you want the freshest possible data, and it deploys behind a password when you want to check it from your phone. Below is the top of it, on sample data.
What it actually shows you
Four questions, answered from the logs rather than from memory.
1. Who actually pulled weight
This is the one that stung. The dashboard counts real invocations per agent, not name-drops in a doc. In the sample below, five agents are working and one, the reviewer, sits at zero. It was defined, given tools, and wired into the org. It has never run. On my own setup I found exactly this: an agent I was sure was in the loop had never been called once.
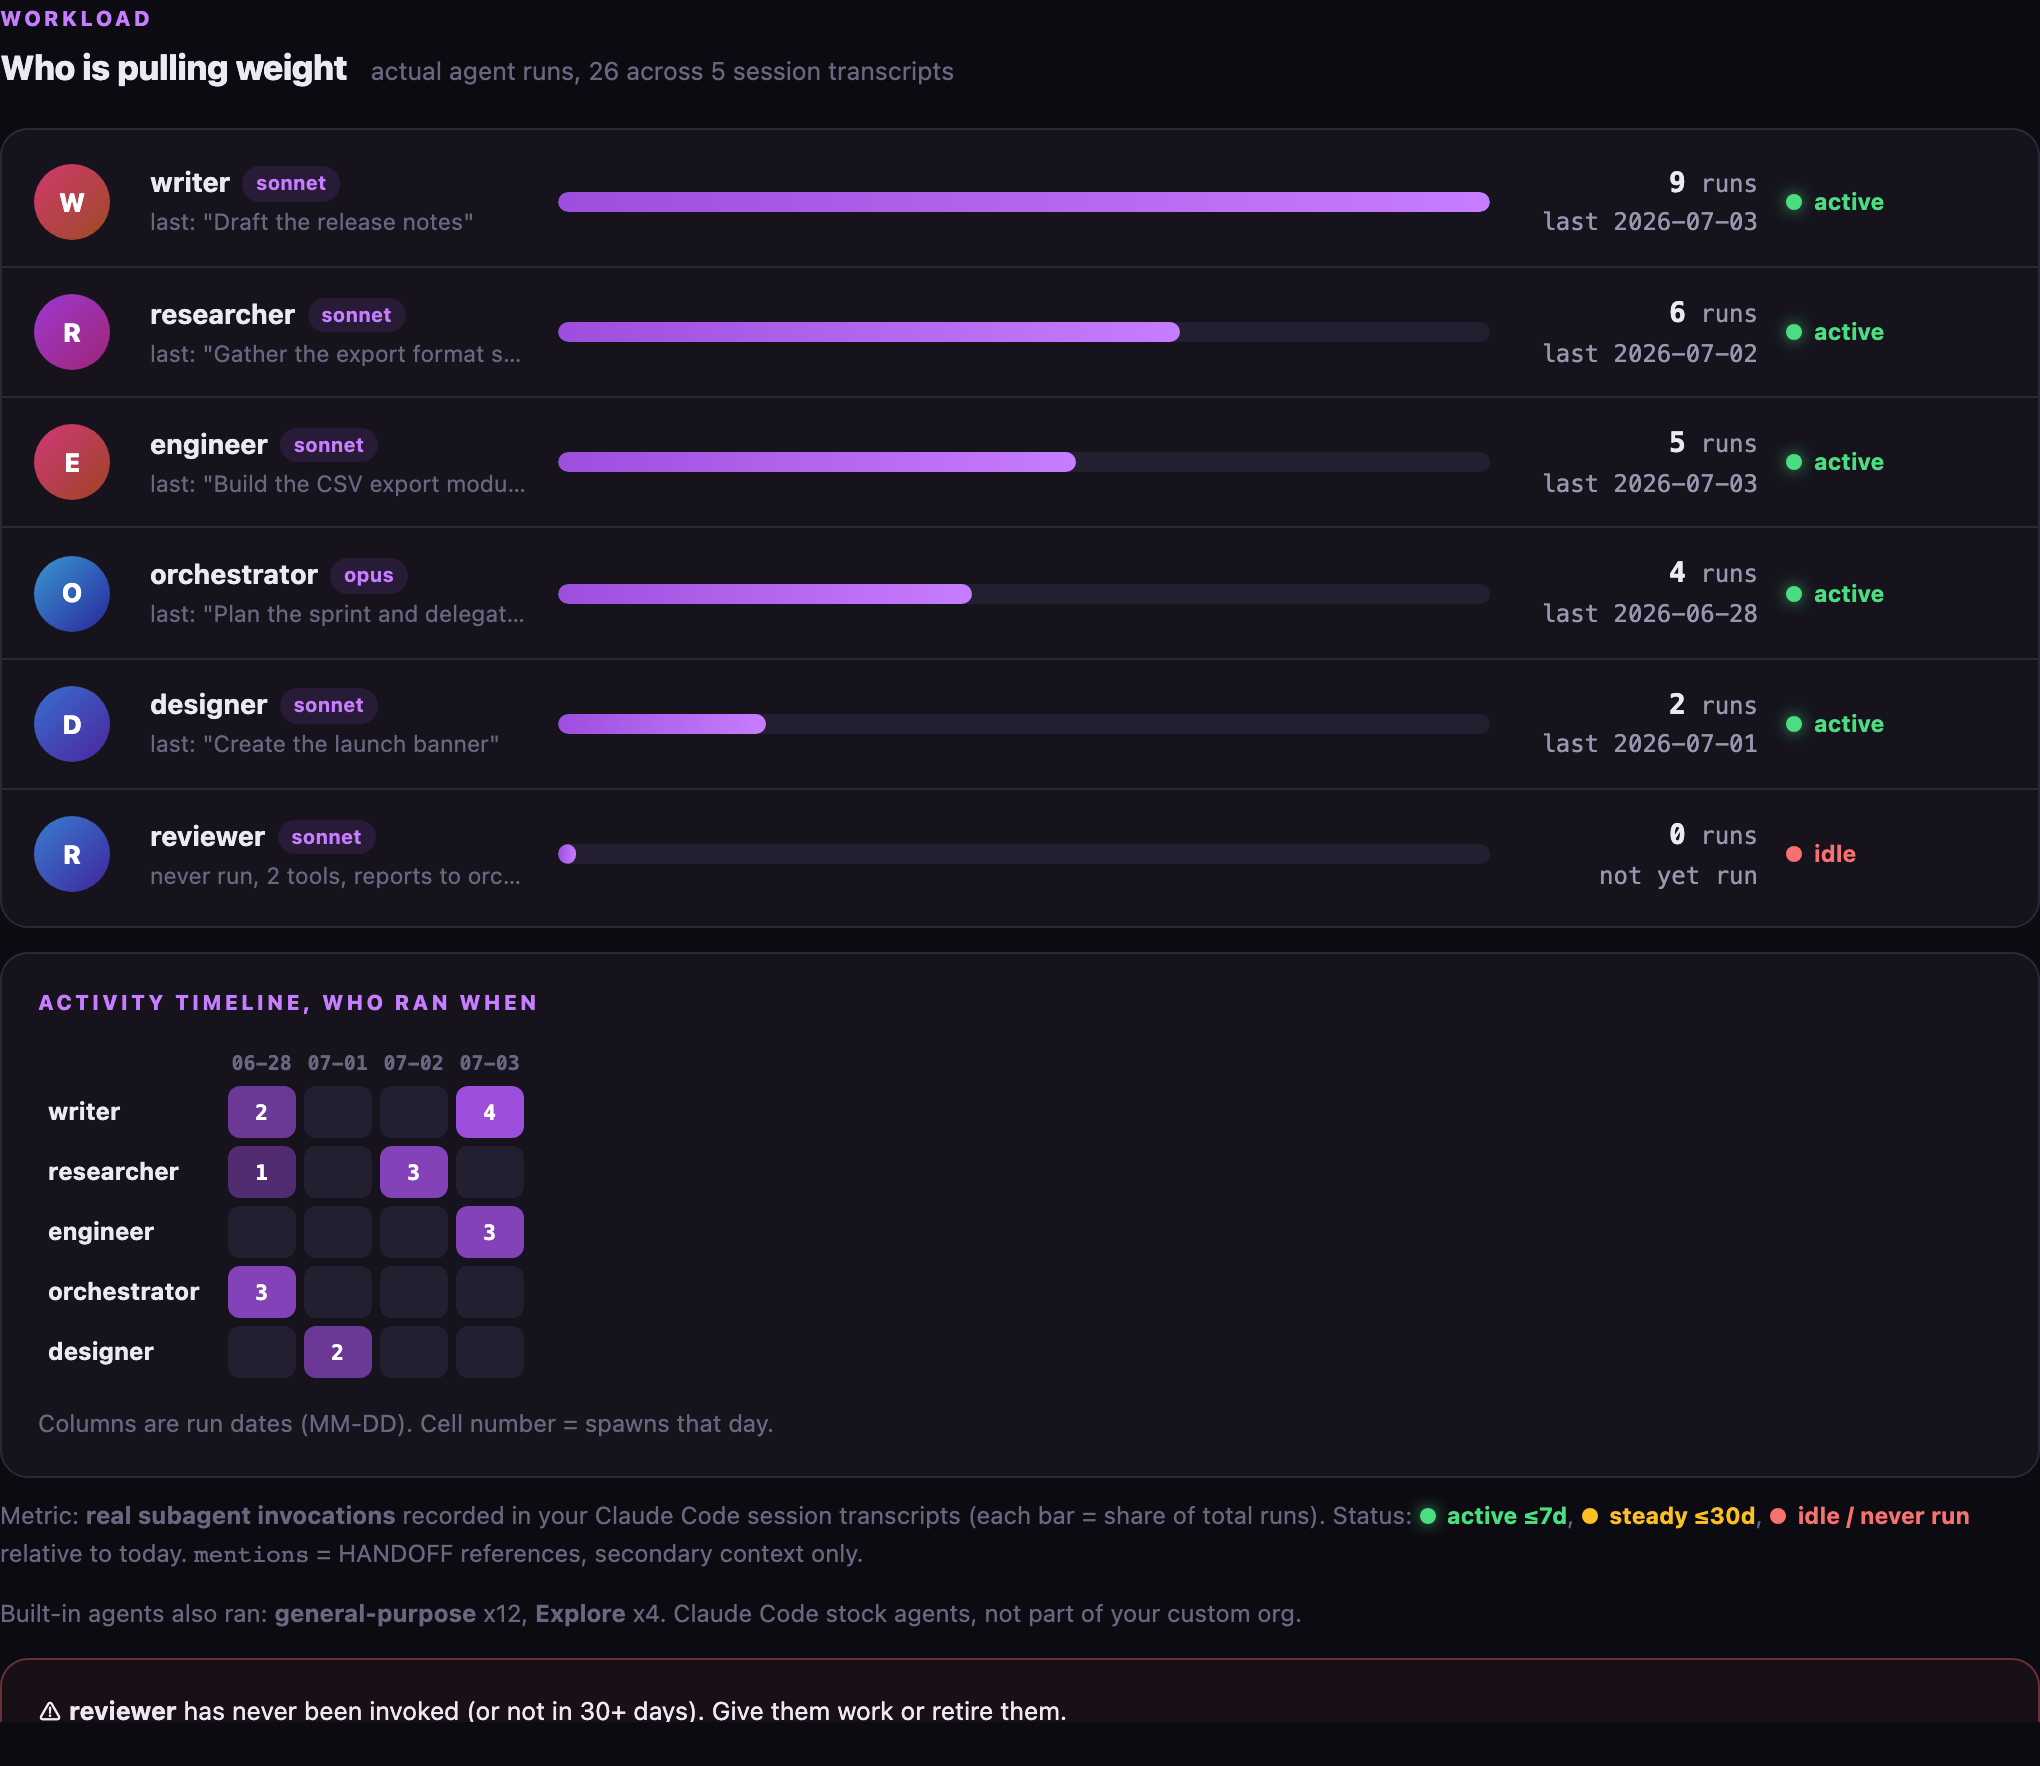
That single fact changes how you build. An agent at zero is either dead weight you can retire, or a gap in your process where work is silently falling through. Either way you want to know, and you will never know it from reading the output.
2. What it cost, and what caching saved
Every assistant turn records exact token usage, so cost is not an estimate. The dashboard splits spend by model, by day, and between the main thread and the isolated sub-agent contexts. It also shows the cache hit rate and the money the cache saved you, because on long agent sessions that is most of the bill.
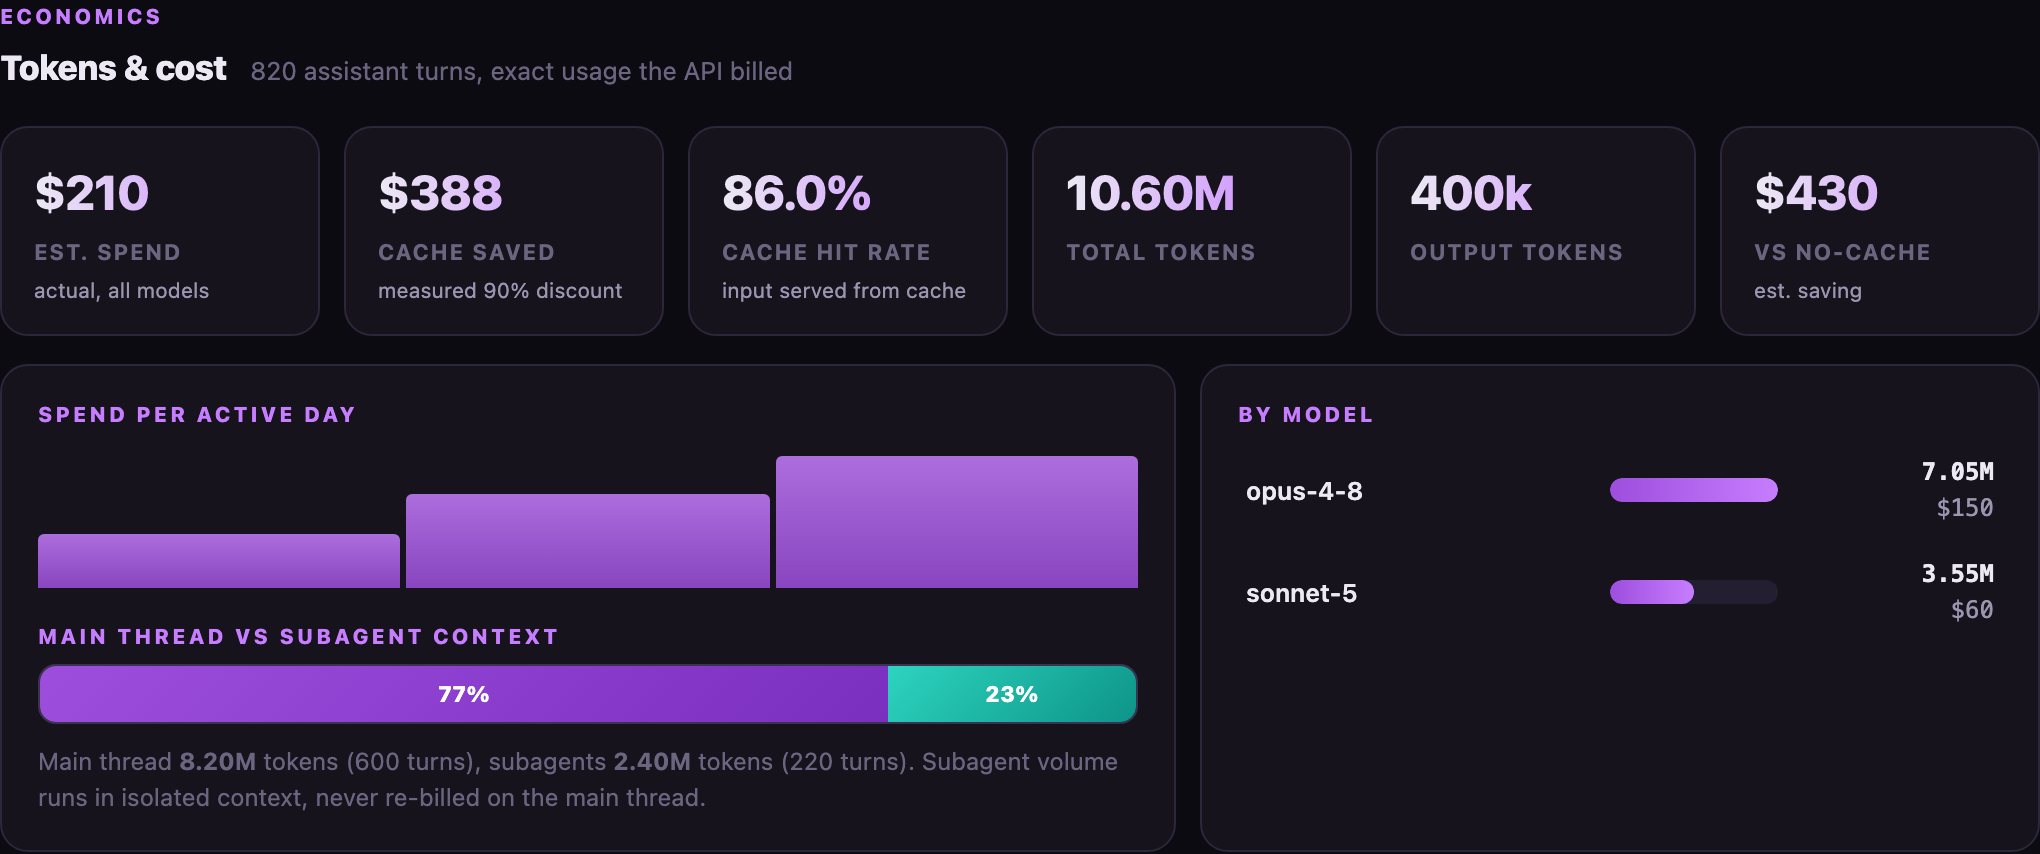
Sample spend: what it cost vs the same work with no caching
3. Which tools fail
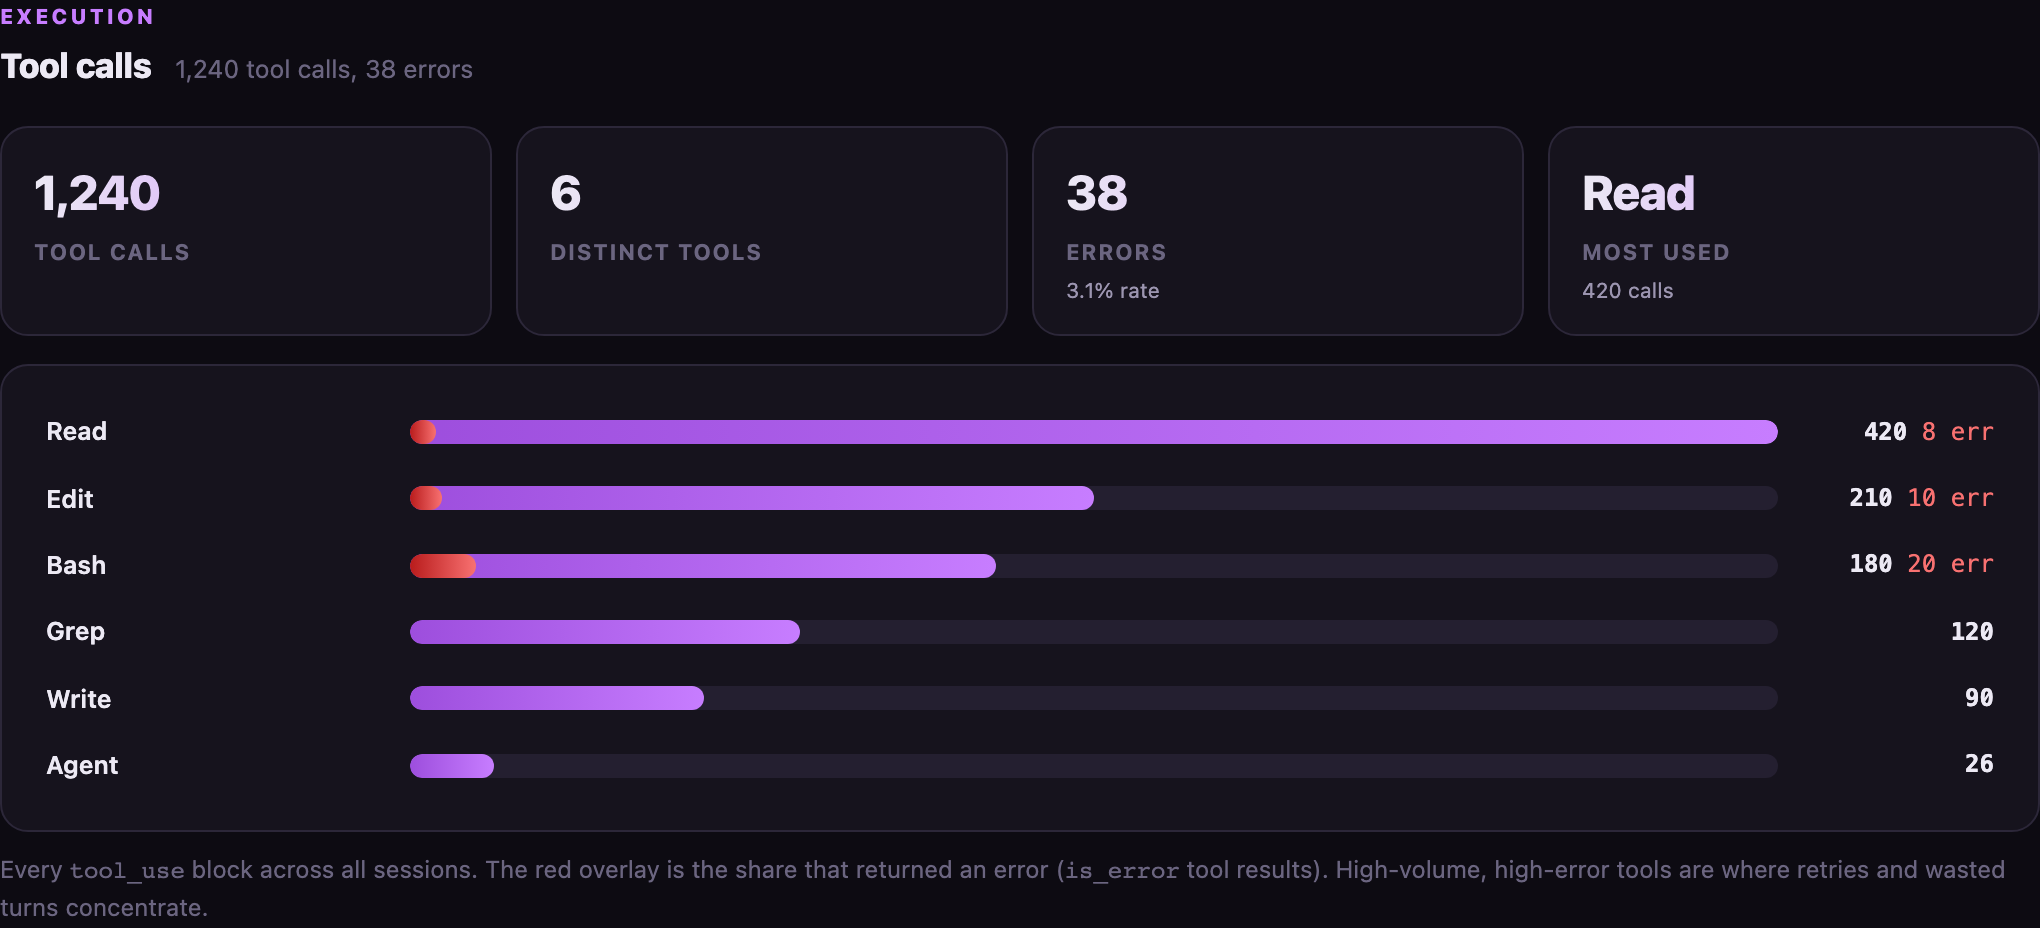
Agents do their work through tools: reading files, editing, running commands, searching. The dashboard counts every tool call across every session and highlights the share that errored. In the sample below there are 1,240 tool calls with a 3.1 percent error rate, and the errors are not spread evenly. They cluster in a couple of tools. That cluster is where your retries and wasted turns live, and it is invisible until you chart it.
4. How long the work took
The sessions view lists each work session with its length, turn count, how many agents it spawned, its token total, and its cost. This is where you spot the run that took three hours and spent real money on a task that should have taken twenty minutes. It is the difference between "the agents are working" and "the agents are working efficiently."
| Session | Length | Turns | Spawns | Cost |
|---|---|---|---|---|
| a1b2c3d4 | 2.5h | 120 | 6 | $100 |
| e5f6a7b8 | 1.2h | 70 | 2 | $70 |
Sample sessions. Real ones show you exactly where the time and money went.
How the data actually gets there
The honest part. A deployed dashboard on a server cannot reach into your laptop and read your agent logs. Those files live on your machine. So the flow has one local step, and understanding it is the difference between "live magic" and something you can actually trust.
- Your agents run and get logged. Every time an agent is spawned or takes a turn, the runtime writes it to a session transcript on disk. This already happens. You do nothing.
- A local command rolls the logs into a snapshot. It reads the transcripts and the project, computes who ran, the token cost, the tool breakdown, and the session timeline, and writes one small data file.
- You publish the snapshot. Commit and push it to a private repo, and the hosted dashboard redeploys with the fresh numbers, served only behind your password.
How to use it, start to finish
The whole setup is an afternoon. The habit it builds is the part that lasts.
- Point it at your agent transcripts. It auto-locates the standard log folder for your project. One environment variable overrides it if your logs live elsewhere.
- Run the snapshot command. It reads everything and writes the data file. Review it locally in the browser with a single command, no build step.
- Deploy it behind a password. Set one environment variable for the access password, deploy, and open the URL. It is private by default, not indexed by search engines, reachable only by direct link.
- Refresh when you want. Run the publish command after a session, or wire it to a schedule so it updates on its own.
What I found when I finally looked
The numbers on this page are from the sample view, but the pattern held on my own data, and it was not what I expected.
- An agent I was certain sat in the middle of my process had never run once. The output was fine because the work was quietly happening elsewhere. The org chart was a story I was telling myself.
- My spend was lower than I feared, because most of my input was served from cache rather than paid for twice. I could finally see the split instead of guessing at it.
- My tool errors were concentrated in two tools. Fixing how the agents used those two removed a chunk of silent retries I did not know I was paying for.
None of that is visible in the output. All of it is obvious in the logs. That is the whole argument for looking.
Private by design
One deliberate choice worth calling out. This shows how much and how your team of agents works, which is exactly the kind of thing you do not want on the open web. So the hosted version is gated behind a password, marked no-index so it never shows up in search, and reachable only by the direct link. Your real data leaves your machine only to sit behind your own lock. The demo you have been looking at uses generic sample agents on purpose.
The playbook
- Measure the process, not just the output. A good result does not prove the agent ran. The logs do. Read them.
- Hunt for the idle agent. The most useful number is the agent at zero. It is either dead weight to retire or a gap where work is falling through.
- Watch the cache split, not just the total. On long agent sessions most of the bill is cached prefix reads. If you cannot see that split you cannot manage the cost.
- Chart your tool errors. They cluster. The cluster is where retries and wasted turns hide, and it is invisible until you plot it.
- Refresh on a rhythm. A dashboard you check once is a screenshot. A dashboard you refresh after every session is a habit that changes how you build.
The build is the easy part now. Anyone can wire up a team of agents in an afternoon. Knowing whether that team actually pulled its weight, and what it cost you, is the part almost everyone is skipping. That is the part worth building.
Want to run this on your own agents?
It is a small, self-contained app you can deploy yourself. Point it at your logs, set a password, done.
See it and get the app →Amit